EasyR - How to easily calculate basic descriptive statistics in R
Video Not Working? Fix It Now
This video will demonstrate some easy commands used to start to analyze your data in a descriptive way. this includes how to calculate mean (average), median, range, quartiles, variance, and standard deviation. Links to video sections and data files are in the description below.
Data files used in this video:
heights_wide.csv: https://www.mediafire.com/file_premium/zd2mksezdjnpvwe/heights_wide.csv/file
heights_long.csv: https://www.mediafire.com/file_premium/94qo5y6bhqvzo8l/heights_long.csv/file
Sections:
00:00 Intro
01:50 Setting a theme
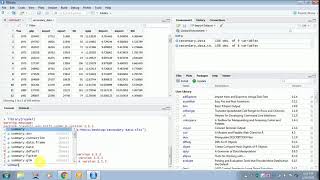
03:10 Loading and viewing a data set
12:30 Calculating mean, median, and standard deviation
17:59 Calculations from a "long format" dataset
Subscribe here: https://www.youtube.com/channel/UCJPwNOsvugkB2ImVCiaLytA?sub_confirmation=1
Comment