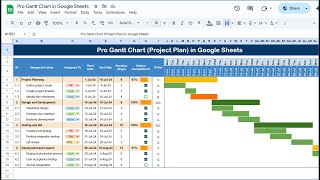
How to Create a Gantt Chart in Google Sheets
Video Not Working? Fix It Now
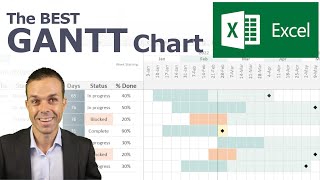
Learn how to create a Gantt Chart in Google Sheets to use as a simple and powerful project management tool. This video is a useful Google Sheets tutorial for project managers. You can follow it step-by-step, or you can get the free template from the link below:
https://www.vertex42.com/ExcelTemplates/simple-gantt-chart.html
CONTENTS
0:00 Introduction
0:17 Add Tasks and Dates
0:52 Create Task Dependencies Using Formulas
1:26 Create the Timeline
3:08 Format the Data and Timeline
5:15 Add the Bars of the Gantt Chart using Conditional Formatting
6:33 Make the Timeline Dynamic (a scroll-like feature)
7:27 Highlight the Current Date using the TODAY function
7:57 Add Progress Bars for Each Task using the SPARKLINE function
9:26 Calculate the Start and End Dates for Summary Tasks
9:52 Use the Group Rows Feature to Show/Hide Sub Tasks
10:12 Correction: The shortcut to group rows is SHIFT+ALT+RightArrow
👍 Remember to Subscribe and Turn on Notifications (click on the bell)
MORE GANTT CHART TEMPLATES
Another free Gantt Chart for Google Sheets can be found here:
https://www.vertex42.com/ExcelTemplates/excel-gantt-chart.html
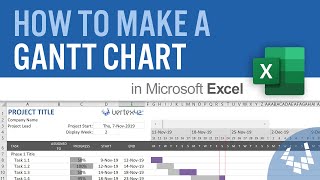
MAKE A GANTT CHART IN EXCEL
Watch our popular video series on how to make a gantt chart in Microsoft Excel:
https://www.vertex42.com/ExcelTips/how-to-make-a-gantt-chart-in-excel.html
GANTT CHART TEMPLATE PRO:
A more feature-packed version for Google Sheets is available via the Pro package. It includes color-coding, more ways to define tasks and predecessors, and lets you change the timeline from daily to weekly or monthly. See the link below:
https://www.vertex42.com/ExcelTemplates/gantt-chart-template-pro.html
MUSIC CREDITS: Pixelate, by Zac Nelson, licensed via ArtList
Comment