Non Linear Regression Analysis - Quadratic Model using SPSS #datascience #dataanalytics
Video Not Working? Fix It Now
Non Linear Regression Analysis Quadratic Model using SPSS #datascience #dataanalytics #spss
If you are interested in learning online course on SEM (Structural Equation Modeling) with Amos. Please, check the following link https://myeasystatistics.graphy.com this course covers 16 captivating topics! Enjoy lifetime access to the course videos, practice materials, and you can Elevate your statistical skills to high levels.
Get a discount of 20% on the purchase by using the discount code : SEM2023
📊 Welcome to "My Easy Statistics"! Prepare to be captivated as we embark on a fascinating exploration into the world of statistics, where we'll unveil the true potential of quadratic curve linear regression. Join us as we demystify the art of regression analysis and apply it to the intriguing puzzle of the height-weight relationship.
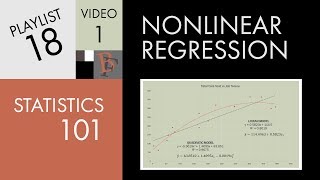
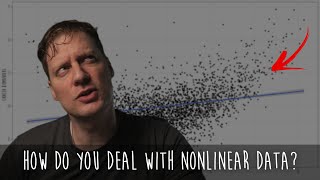
📈 While linear regression is a well-known concept, it often paints a simplistic picture of the world. Real-life data, however, is rarely so straightforward. That's where nonlinear regression models come into play, and in this video, we shine the spotlight on quadratic curve linear regression—a powerful tool for deciphering complex relationships.
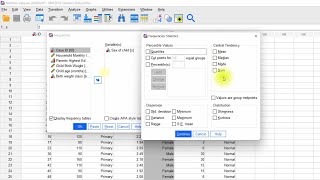
🔍 In this enlightening case study, we'll dive deep into the analysis of data from 55 individuals, meticulously processed using the robust SPSS software. Our mission? To uncover the hidden nuances in the connection between height and weight.
Here's a sneak peek of what awaits you: 🔍 Hypothesis: We begin with the intriguing hypothesis that there may be no significant relationship between height and weight. 📊 Data: Our dataset boasts 55 respondents, each contributing measurements of their height (in centimeters) and weight (in kilograms).
Revealing Insights from the Linear Model: 📈 Linear Model Summary:
• R-Value: 0.598 (Moderate positive correlation)
• R-Square: 0.357 (Explaining 35.7% of weight variance)
• Adjusted R-Square: 0.345 (34.5% variance while considering other factors)
• Standardized Error of Estimation: 8.879 kg 📊 ANOVA Table:
• F-Statistic: 29.485 (Unquestionably significant relationship)
• P-Value: 0.000 (Statistical significance at its finest)
Unveiling the Triumph of the Quadratic Model: 📈 Quadratic Model Summary:
• R-Value: 0.695 (A stronger correlation emerges)
• R-Square: 0.482 (Unraveling 48.2% of weight variance, surpassing linear) 📊 Coefficients:
• Height: -19.054 (Weight initially decreases with height)
• Height Square: 0.065 (Weight increases after reaching a pivotal point)
• Intercept: 1446.612 (A significant starting point)
The Grand Finale: 🔍 Our comprehensive analysis leads to a riveting conclusion—the quadratic model reigns supreme in decoding the intricate relationship between height and weight. Visualized through a captivating parabolic curve, we unveil how weight initially wanes with height, only to surge beyond a crucial threshold.
📊 Whether you're a curious student, an avid researcher, or a data enthusiast, this video is your ticket to mastering the art of quadratic curve linear regression. Join us on this thrilling statistical journey and remember to like, share, and subscribe for a regular dose of statistical wisdom! Thank you for choosing "My Easy Statistics" as your trusted guide in the world of data analysis.
Keywords:
quadratic curve estimation analysis using SPSS, quadratic curve estimation, curve estimation analysis, quadratic curve estimation SPSS, curve estimation SPSS, SPSS quadratic curve estimation, curve estimation using SPSS, quadratic curve, curve estimation, SPSS, estimation analysis, quadratic curve SPSS tutorial, quadratic curve estimation in SPSS, curve estimation analysis in SPSS, how to do quadratic curve estimation in SPSS, quadratic curve estimation using excel, curve estimation using excel, excel quadratic curve estimation tutorial, excel curve estimation analysis tutorial, how to do curve estimation in excel, quadratic curve estimation python, curve estimation python, python quadratic curve estimation tutorial, python curve estimation analysis tutorial, how to do quadratic curve estimation in python
Please, subscribe the channel, Like and share the video with the other researchers.
Contact me for Data Analysis and Training @ gnsatishkumar@gmail.com
What's App +91 9849676109 or +91 8555041411
#DATAANALYTICS #DATASCIENCE #PREDICTIVEANALYTICS #MultivariateAnalysis
List of my other videos which you may be Interested:
Henry Garrett Ranking Method with an Example
https://www.youtube.com/watch?v=ZyPjk...
Multiple Response Analysis using SPSS Statistics
https://www.youtube.com/watch?v=JhzaF...
Exploratory Factor Analysis using SPSS
https://www.youtube.com/watch?v=Ahrza...
Cronbach's alpha Reliability test using SPSS
https://www.youtube.com/watch?v=AE5-I...
Cronbach's alpha Reliability test using PSPP
https://www.youtube.com/watch?v=8i9K5...
SPSS
quadratic curve estimation analysis using SPSS
quadratic curve estimation
curve estimation analysis
quadratic curve estimation SPSS
curve estimation SPSS
SPSS quadratic curve estimation
curve estimation using SPSS
quadratic curve
curve estimation
estimation analysis
quadratic curve SPSS tutorial
quadratic curve estimation in SPSS
curve estimation analysis in SPSS
how to do quadratic curve estimation in SPSS
curve estimation using excel
curve estimation python
Comment