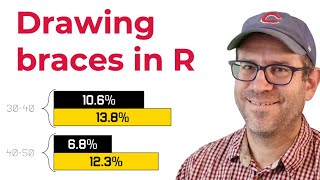
Recreating gradient colored lines in R with ggforce's geom_link function (CC328)
Video Not Working? Fix It Now
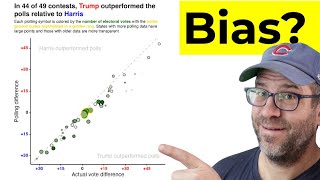
Pat recreates a gradient colored barbell plot made by Nate Silver in R with the help of the ggplot2, ggforce, ggtext, and glue packages. The "handle" of this dumbbell plot was made into a gradient of colors using the geom_link function from the ggforce package. Along the way he also uses the annotate, geom_point, geom_textbox, scale_x_continuous, scale_y_continuous, coord_cartesian, scale_color_gradient, scale_fill_manual, labs, theme_manual, and theme functions. You can find the code he developed in this episode at https://www.riffomonas.org/code_club/2024-12-30-polling-gradient. Nate Silver's newsletter can be found at https://www.natesilver.net/p/hopium-comes-at-a-high-price. Pat's newsletter describing how he would go about generating the figure can be found at https://shop.riffomonas.org/posts/visualizing-bias-in-polling-data-with-a-dumbbell-plot.
If you have a figure that you would like to see me discuss in a future newsletter and episode of Code Club, email me at pat@riffomonas.org!
Want more practice on the concepts covered in Code Club? You can sign up for my weekly newsletter at https://shop.riffomonas.org/youtube to get practice problems, tips, and insights. If you're interested in purchasing a video workshop be sure to check out https://riffomonas.org/workshops/
Support Riffomonas by becoming a Patreon member!
https://www.patreon.com/riffomonas
You can also find complete tutorials for learning R with the tidyverse using...
Microbial ecology data: https://www.riffomonas.org/minimalR/
General data: https://www.riffomonas.org/generalR/
If you want to cite this video, please consider citing https://journals.asm.org/doi/10.1128/mra.01310-22
0:00 Introduction
6:24 Creating major components of figure
21:53 Creating a gradient colored dumbbell
30:11 Adding (and hiding) vertical line at zero
37:21 Cleaning up appearance of titles and labels
42:41 Adding legend to top of figure
Comment