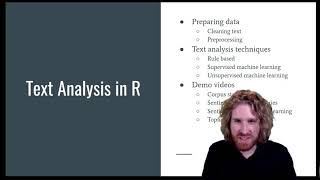
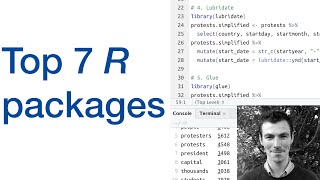
Text analysis / mining in R - how to plot word-graphs
Video Not Working? Fix It Now
🔔 *Subscribe for weekly R videos:* https://www.youtube.com/channel/UCb5aI-GwJm3ZxlwtCsLu78Q?sub_confirmation=1
Here's an easy approach to start using R to generate insights from text data. I'll take you through the process of exploring themes in text data by visualizing the relationships between words, using a real dataset with user reviews of the Animal Crossing game. To do this, we'll use R, the tidytext package, and the ggraph package. This is an intro to the basics of text analysis in R.
🎉 *Enjoyed this video?* Leave a comment below to share what you liked the most!
0:00 Intro
1:05 Load packages
2:00 Read user reviews data
2:25 Basic exploratory data analysis
3:37 Extract words
6:55 Calculate word counts & correlations
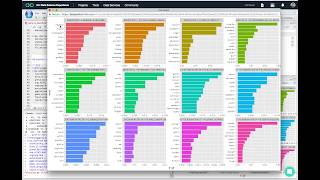
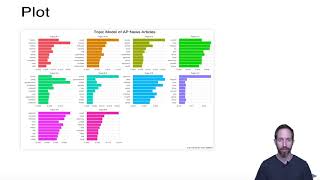
9:20 Plot word relationships
15:35 Clean code & build the function
19:55 Generate plots for NEGATIVE reviews
23:29 Generate plots for POSITIVE reviews
25:20 The end!! (SUBSCRIBE!! :) )
Data used: Animal Crossing user reviews, https://github.com/rfordatascience/tidytuesday/blob/master/data/2020/2020-05-05/readme.md
Comment