Xbar and R chart I Create Control chart in Excel I Create Xbar R chart in Excel | 7 QC Tools
Video Not Working? Fix It Now
Xbar and R chart I Create Control chart in Excel I Create Xbar R chart in Excel
My YouTube Gears / Devices & Equipments
My Smartphone: https://amzn.to/3bvY9xt
My Microphone: https://amzn.to/3lRobQl
My Laptop: https://amzn.to/2QWSHKz
About the Video:
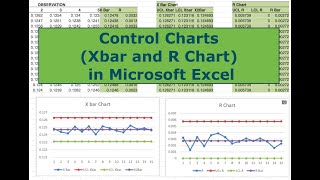
Create Control chart in Excel
X bar and R chart is a control chart used for Variable Data. Control chart is part of SPC (Statistical Process Control). Control chart is also one of the 7 qc Tools. Xbar & R chart in nothing but combination of two charts. Average chart (Measurement of Central Tendency of Data) and Range Chart (Measurement of Dispersion of Data). Also explained here is how to create X bar and Rchart in Excel step by step.
How to create Xbar and Rchart is explained here which includes, how to calculate;
1. Xbar – Average
2. Xdbar = Average of Averages
3. R – Range
4. Rbar – Average of Ranges
5. UCL and LCL of Xbar chart
6. UCL and LCL of R chart etc…
#xbarrchart #controlchart #xbarchart #rchart #qualityexcellencehub #qehenglish
Quality Excellence Hub Channel introduction:
Hi,
I am Parthasarthi Virda. Welcome to my Youtube channel "Quality Excellence Hub".
Thank you so much for watching my videos. Watch other videos from ‘Quality Excellence Hub’- Link of video Gallery https://www.youtube.com/channel/UCMy3BBMGpVQFrhlpexX6rpw/videos?disable_polymer=1
Also find videos on other topics as below
Videos in Hindi Language
1. 7 QC Tools – Hindi https://youtu.be/IiH91xiMnuY
2. What is Quality – Hindi https://youtu.be/yKXuxMTGoeM
3. What is Audit – Hindi https://youtu.be/oGInLTpskZs
4. What is Kaizen – Hindi https://youtu.be/C5qfsJqiOhM
5. SMED – Hindi https://youtu.be/0d78jxnOaeQ
6. Cost of Quality – Hindi https://youtu.be/xyDQsXeLUIE
7. QA vs QC – Hindi https://youtu.be/zQ18t400p1g
8. 5W & 1H – Hindi https://youtu.be/IC7lgi-tYo0
9. Verification vs Validation https://youtu.be/Uluxxk79bjk
10. Checksheet – Hindi https://youtu.be/IuBPRpElTFE
11. What is Histogram – Hindi https://youtu.be/lpYODOZdHS8
12. Mean Median Mode – Hindi https://youtu.be/1Cx_kLKDd34
13. Takt time cycle time lead time Throughput time – Hindi https://youtu.be/asQtRYyGJlE
14. Overall Equipment Effectiveness (OEE) – Hindi https://youtu.be/yEfR7w1F-cc
15. Paretochart – Hindi https://youtu.be/81fdc0YAnjk
16. How to create Pareto chart in Excel – Hindi - https://youtu.be/pXd8DStkzT4
Videos in English Language
17. 7 QC Tools – English https://youtu.be/bUykjMUZ2BQ
18. What is Quality – English https://youtu.be/bXhSAIHAJp0
19. Cost of Quality – English https://youtu.be/BTzn3JnDHlY
20. What is an Audit – English https://youtu.be/Ulgng6GoJVg
21. Quality Assurance vs Quality Control – English https://youtu.be/RzOqExLM-co
22. Verification vs Validation – English https://youtu.be/B-0FR1GJwr4
23. Production Part Approval Process (PPAP) – English https://youtu.be/gymZIVqXrPI
24. Measurement System Analysis (MSA) - https://youtu.be/GJFLIGmnpzI
25. 5W & 1H – English https://youtu.be/R4Gdq-GC9LM
26. What is Kaizen – English https://youtu.be/DlEx0FzIaf4
27. Takt time cycle time lead time Throughput time – English https://youtu.be/WwIsMAgqjEE
28. Single Minute Exchange of Die (SMED) – English https://youtu.be/ansnB2uzUXk
29. Checksheet – English https://youtu.be/GjV1UL_Z_SY
30. Pareto chart – English https://youtu.be/FVo-0PsrECk
31. Corrective Action and Preventive Action (CAPA) – English https://youtu.be/tgbAEvIP2oI
32. Histogram – English https://youtu.be/gYpD8jR0ULw
33. Tatistical Process Control (SPC) - https://youtu.be/lOEqli-YV2I
34. Mean Mode Median – English https://youtu.be/FUd7vF_v3F0
Other Social Links of channel:
YouTube - https://www.youtube.com/c/QualityExcellenceHub
Facebook - https://www.facebook.com/qualityexcellence.hub
LinkedIn - https://www.linkedin.com/in/parthasarthi-virda-88b6352a/
Pinterest - https://in.pinterest.com/qehub2018
Instagram - https://www.instagram.com/p_virda/?hl=en
Email - qehub2018@gmail.com
music and video from
www.incompetech.com
www.pixabay.com
www.yummy-sounds.com
www.productioncrate.com
Xbar R chart
Control chart in Excel
Average and Range chart
Xbar & R chart
Quality Excellence Hub
control charts
control chart
x bar chart
r chart
x bar chart in excel
x bar chart in quality control
create X-Bar & R Chart in excel
Control chart
X-Bar & R Chart tutorial
X-Bar & R Chart video
control chart in excel
control chart in excel video
How to make Control chart in excel
How to create Control chart in excel
x bar r chart
xbar and r chart
Comment